Your best-selling variant is nearly gone, a supplier wants your next purchase order, and a shelf of slower products is still tying up cash. Last month's sales spreadsheet doesn't make the decision much easier, especially when you've changed prices, run a promotion, or launched something new.
AI powered demand forecasting can help you make that decision more systematically. But a useful forecast isn't just a confident-looking sales number. It's an estimate with uncertainty attached, tested against a simpler alternative and judged by whether it improves your inventory decisions after costs.
Table of Contents
- What AI Demand Forecasting Does for a Shopify Store
- The Data a Forecast Needs, and What to Do Without It
- Choosing Between Statistical and Machine-Learning Models
- Metrics That Show a Forecast Is Accurate
- Connecting Forecasts to Shopify Inventory and Automation
- How to Build the Forecast in Four Phases
- Pitfalls That Quietly Undermine Forecasts
- Start With One Collection and Measure the Result
What AI Demand Forecasting Does for a Shopify Store
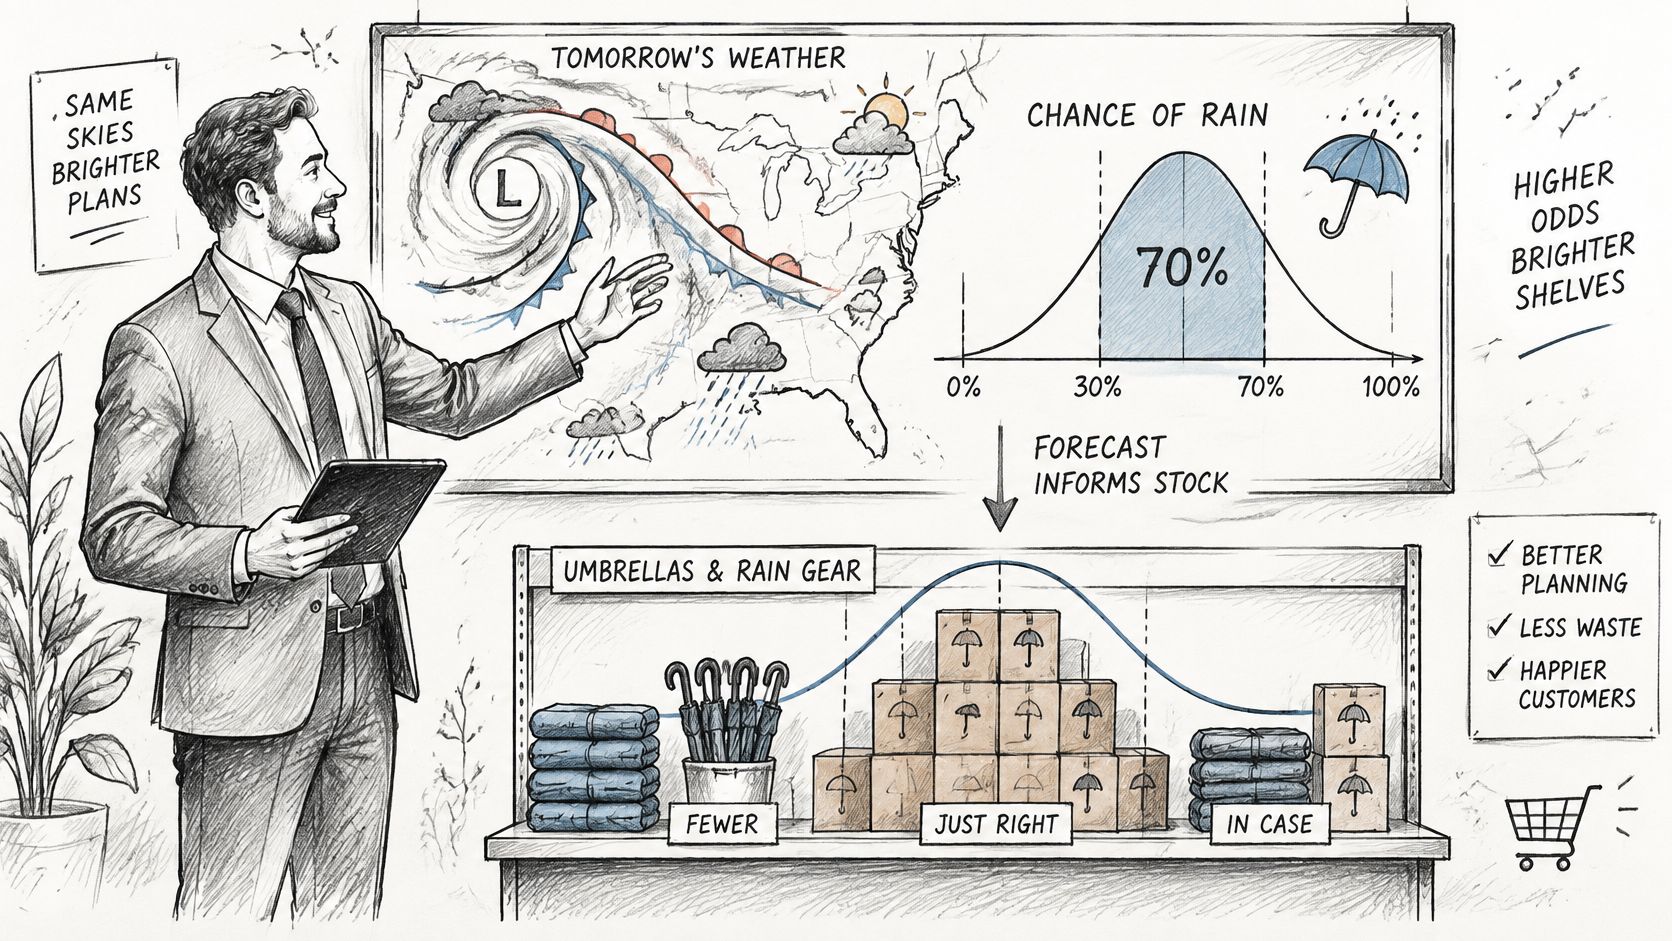
A weather forecast helps you decide whether to carry an umbrella without promising exactly when rain will fall. A demand forecast serves a similar purpose: it estimates future sales and shows how much uncertainty surrounds that estimate.
Say you sell rain jackets through Shopify. Your buyer needs to place an order before the next delivery window, but recent sales include a discount campaign and a period when the most popular size was unavailable. Repeating last month's average would treat those conditions as normal.
AI-powered demand forecasting uses a model to connect sales patterns with relevant conditions, such as price, discounts, inventory availability, traffic, campaign dates, weekdays, and seasonality. Instead of treating every selling period alike, you give the model context for interpreting what happened.
The weather analogy makes the relationship between uncertainty and inventory easier to see.
Turn an estimate into a buying decision
The central estimate tells your buyer what demand might look like. A prediction interval adds a plausible range, helping the buyer distinguish a relatively predictable staple from a product whose demand could move sharply.
That matters for safety stock, the buffer you hold against uncertainty. A 2025 systematic review reported that probabilistic AI forecasting enabled approximately 12% lower safety-stock requirements while maintaining the same service level. Treat that finding as evidence of what's possible in the reviewed settings, not a promised reduction for your store.
The forecast still doesn't know everything your buyer knows. Supplier minimums, cash constraints, delivery reliability, and a planned product discontinuation can change the order you should place.
Practical rule: Let the forecast propose demand. Let the buyer decide how to respond.
For your rain-jacket collection, the useful output isn't only a projected sales total. It should support concrete choices:
- What to reorder: Identify variants likely to need replenishment.
- When to reorder: Allow for demand while the supplier prepares and delivers stock.
- How much buffer to hold: Match protection against uncertainty to the commercial consequences of running short.
The potential benefits are fewer unavailable best sellers, less cash committed to excess inventory, and fewer markdowns. You'll need to measure those outcomes against your current buying process.
The Data a Forecast Needs, and What to Do Without It
Before choosing a model, check whether your store can produce a reliable record of what customers could buy, what they bought, and what changed around the purchase.
Build an input checklist at variant and location level:
- Unit sales: Record daily or weekly quantities, with cancellations and returns handled consistently.
- Availability: Keep stockout dates and inventory history, not just today's inventory balance.
- Commercial changes: Join selling prices, discount codes, and promotion dates to the relevant products.
- Demand signals: Add traffic, campaign calendars, and conversion information where you can connect them meaningfully.
- Calendar context: Include weekdays, holidays, and seasonal events relevant to your customers.
A missing order isn't always evidence of missing demand. If a jacket was unavailable, its sales record shows what you could fulfil, not everything customers wanted. Mark those periods as censored demand rather than treating them as ordinary quiet days.
Match the method to the evidence available
There isn't a universal minimum history that makes a forecast trustworthy. You need enough relevant observations to test the pattern you're relying on, including comparable seasonal or promotional conditions.
Minimum history and signals by product type
| Product type | Usable sales history | Signals to add | Forecast approach |
|---|---|---|---|
| Established evergreen SKU | Consistent history covering the recurring patterns you intend to model | Price, discounts, stock availability | ML model benchmarked against seasonal-naive |
| Seasonal product | Repeated comparable selling seasons | Prior-year same-period sales, campaign calendar | ML model with holiday and season features |
| Recently launched SKU | Early sales sufficient to assess launch conditions, supplemented by comparable products | Traffic, conversion rate, category averages | ML model with category priors and wide intervals |
| New product with no sales | None | Analogous SKUs, preorders, waitlist sign-ups | Scenario model with human override |
| Niche, intermittent SKU | Sparse orders, supported by broader category history | Category or store-level history | Hierarchical forecast reconciled from the category |
A review of new-fashion-product forecasting identifies missing historical sales, stockout-hidden demand, and qualitative appeal as persistent challenges. It also notes that newer methods can require substantial auxiliary data and computing resources. A more advanced model doesn't automatically resolve a cold start.
For a new jacket, use a comparable style as a starting assumption, then adjust for differences in price, audience, season, and campaign support. Category averages can provide a prior, meaning an initial expectation before the new product has much evidence of its own.
Preorders provide a stronger purchase signal than casual interest. Waitlist registrations are useful too, but don't count each registration as a guaranteed sale. For traffic-based scenarios, separate assumptions about visitor volume from assumptions about conversion.
Make thin-data forecasts visibly provisional
When no credible comparable product exists, build low, central, and high demand scenarios. Record the assumptions behind each and let the buyer override them with a written reason.
Keep the inputs aligned through a clear data synchronization process, especially when orders, campaigns, and inventory live in separate systems. If you can't test a SKU's apparent pattern against relevant history, use a fallback and show a range rather than a falsely precise number.
Choosing Between Statistical and Machine-Learning Models
No single forecasting method wins everywhere. A systematic review of 40 peer-reviewed studies found that no single machine-learning method consistently dominates across contexts; performance depends on demand structure, forecast horizon, data quality, baseline choice, and evaluation metric.
Start with the decision horizon. A forecast for an imminent replenishment order has a different job from a projection used to negotiate future supplier capacity. Judge a model at the horizon where your buyer will use it.
Forecasting approaches compared for a store
| Approach | Strength | Limitation | Best fit for a store |
|---|---|---|---|
| Seasonal naive | Repeats the corresponding seasonal pattern and is straightforward to run | Ignores promotions, price, and stock conditions | The benchmark every model must beat |
| Exponential smoothing (ETS) | Simple, explainable, works on modest history | Weak with many interacting drivers | Stable, high-volume staples |
| ARIMA-family models | Captures trend and autocorrelation | Needs cleaned series and reasonably stable patterns | Individual steady SKUs |
| Tree ensembles (XGBoost, LightGBM) | Handles nonlinear effects and can accommodate missing values | Needs careful feature engineering | Structured store catalogs with useful explanatory inputs |
| Deep neural networks | Can learn complex patterns across many series | Can require substantial data, compute, and specialist maintenance | Large catalogs or multi-store datasets |
Give simpler methods a fair chance
Seasonal naive means using the corresponding previous seasonal period as the next forecast. It's deliberately uncomplicated, which makes it valuable: you can see whether the extra work of a more complex model produces a meaningful improvement.
ETS can be a sensible candidate when a staple follows a stable level, trend, or seasonal pattern. ARIMA-family models focus on relationships within the historical series. Neither deserves rejection merely because it isn't marketed as AI.
Tree-based ensembles such as XGBoost and LightGBM are worth testing when you have structured retail inputs. They can represent interactions, such as a discount behaving differently during a campaign than during an ordinary selling period. Missing-value handling still isn't permission to leave important business events undocumented.
Deep neural networks may help when you can learn across many related product series. Don't assume their complexity makes them the right starting point for a small catalog with patchy history.
Compare the same task, not different demonstrations
Give each candidate the same eligible sales history, forecast horizon, and evaluation periods. Combine historical sales features with information you'll know when issuing the forecast, such as planned prices and campaign dates.
Be especially careful with traffic. A model tested using actual future traffic has information your buyer won't possess when placing an order. Use a traffic forecast, a scenario, or only information already available at the decision date.
The useful model is the simplest one that improves the buying decision reliably enough to justify its maintenance.
If the AI candidate can't beat the seasonal-naive benchmark on held-out periods that matter to your store, keep the simpler method.
Metrics That Show a Forecast Is Accurate
A forecast error is the forecast minus the observed outcome. A positive signed error indicates over-forecasting under that convention; a negative one indicates under-forecasting. Absolute-error metrics remove the sign, so they describe the size of the miss rather than its direction.
The metric you choose changes what looks successful. A catalog-wide result can look good while an important variant remains poorly forecast, and a percentage measure can look alarming for a product that rarely sells.
Forecast error metrics and when to use them
| Metric | What it measures | Watch out for | Use it when |
|---|---|---|---|
| MAE | Average absolute error in units | Scale-dependent and hard to compare across SKUs | Judging an individual SKU's forecast |
| RMSE | Error with large misses weighted more heavily | Scale-dependent and sensitive to outliers | Large misses are especially costly |
| MAPE | Average absolute error as a percentage of actual sales | Unstable with low, intermittent, or zero sales | Sales remain sufficiently positive for meaningful percentages |
| WAPE | Total absolute error divided by total actual sales | High-volume SKUs dominate; undefined if total actual sales are zero | Summarizing a catalog or category |
| sMAPE | A symmetric percentage-error measure | Still awkward near zero sales | Comparing differently scaled series with suitable safeguards |
| Quantile (pinball) loss | Accuracy of a chosen demand quantile, penalizing misses asymmetrically | Doesn't directly measure interval coverage | Selecting forecasts for different stockout-risk preferences |
A systematic review of AI-driven demand-planning studies reported 20–40% reductions in MAPE against traditional statistical methods in selected empirical configurations. Those results aren't a reason to use MAPE alone, particularly for a Shopify catalog with intermittent sellers.
Separate size, direction, and uncertainty
Use MAE to answer a buyer's practical question: how far off are we, in units? Use bias to check whether the forecasts consistently lean high or low. A model can have an acceptable average absolute miss while repeatedly leaving your buyer short.
For probabilistic forecasts, assess quantile loss and interval coverage separately. Quantile loss scores the selected quantile; coverage checks how often outcomes fall inside the stated interval. Also inspect interval width, because an extremely broad interval may cover demand while offering little buying guidance.
Evaluate campaign periods separately from ordinary trading. Otherwise, routine periods can hide weak performance during the events that generate your largest orders.
Keep catalog totals coherent
A hierarchical forecast estimates demand across store, category, and SKU levels, then reconciles them so the totals agree. This helps a buyer connect a collection-level budget to variant-level purchasing.
Define the hierarchy carefully if products belong to overlapping collections. Don't accidentally count the same variant repeatedly when calculating a store total.
After deployment, keep an operational scorecard alongside model error: service level, stockout rate, inventory turns, and markdowns. These measures reveal whether a statistically useful forecast is helping the team manage inventory, rather than merely producing a better-looking chart.
Connecting Forecasts to Shopify Inventory and Automation
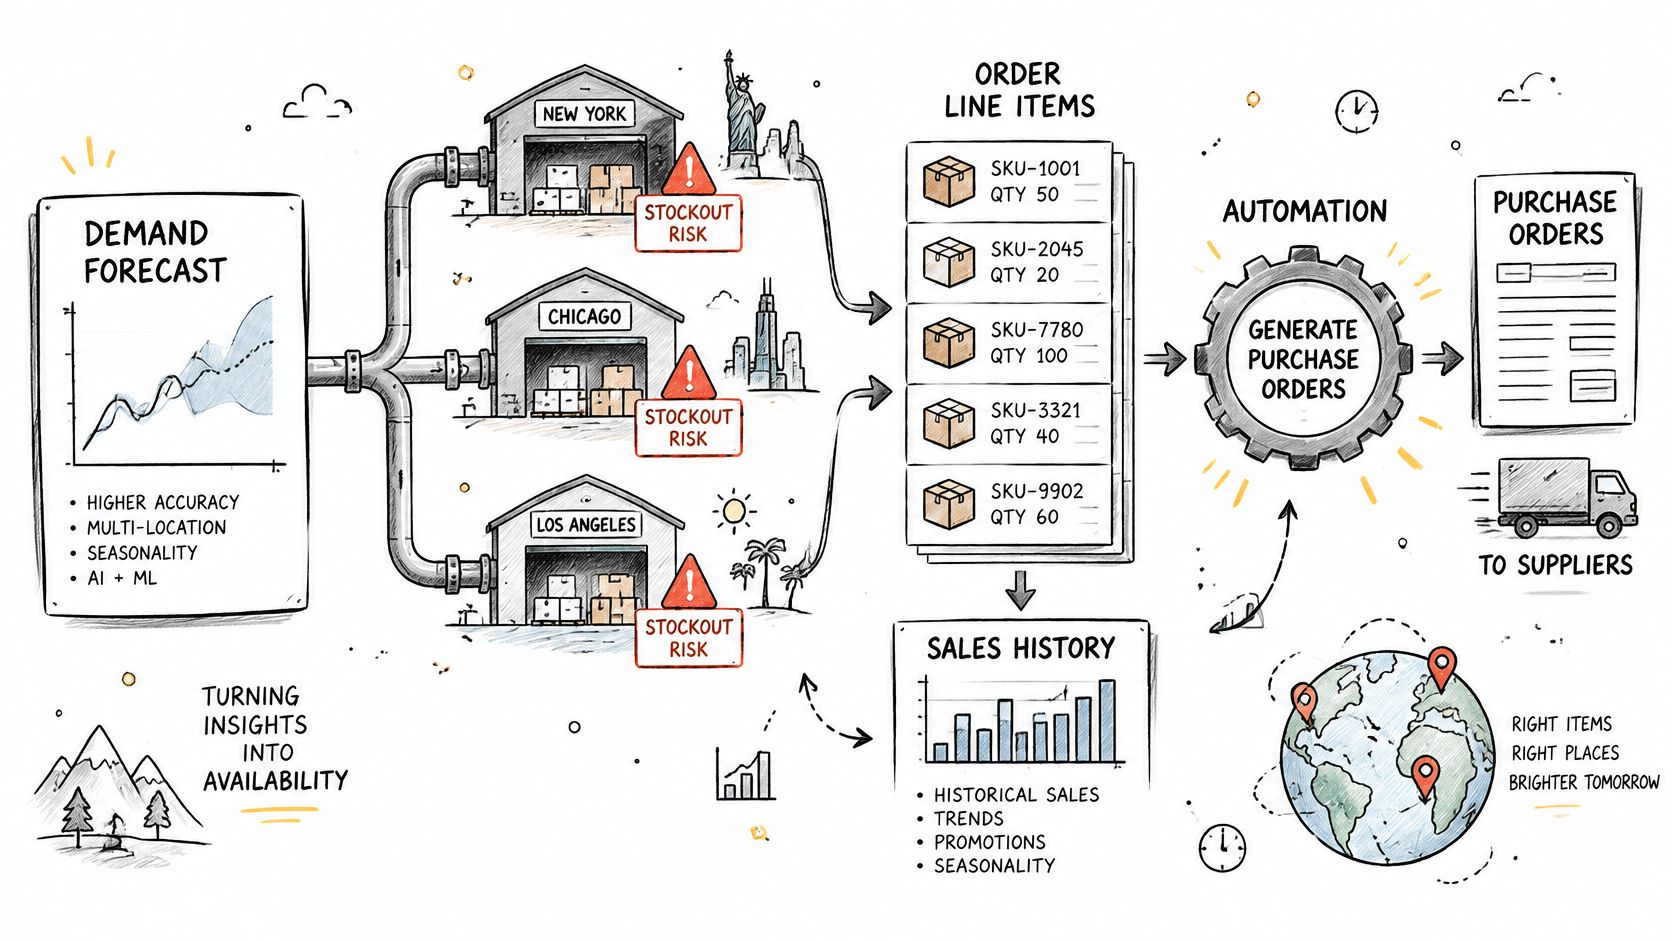
Treat the integration as a controlled flow from Shopify records to a buyer's review screen. Start by deciding which records identify demand, which identify availability, and which describe the conditions around a sale.
This diagram illustrates how a forecast can sit between location-level inventory records and replenishment decisions.
Build a dependable data flow
Use order line items for unit-sales history and product variant IDs as stable joining keys within the store. Keep human-readable SKU codes too, but don't rely on them alone if your team edits or reuses them.
Inventory levels by location provide the availability signal. Capture historical changes because a current balance can't reconstruct every past stockout. Keep transfers separate from customer demand so moving stock between warehouses doesn't appear as a sale.
Collections can supply category groupings, while product tags can identify campaign participants. Preserve historical campaign assignments and selling prices rather than assuming today's tags and prices describe past orders.
For the operating workflow:
- Refresh the inputs: Use scheduled imports or suitable order and inventory webhooks.
- Check completeness: Flag missing locations, unmatched variants, and delayed imports before generating recommendations.
- Publish the result: Show the forecast, uncertainty range, available inventory, incoming supply, and proposed action together.
- Route exceptions: Send unusual changes to a buyer instead of accepting them without review.
Automate preparation before purchasing
Choose a refresh schedule that matches how quickly buying decisions change. A catalog with frequent replenishment needs a different rhythm from a slow-moving assortment with long supplier commitments.
In our app workflows, bulk runs can target all products, a collection, or a hand-picked selection, immediately or on schedules repeating weekly, monthly, or quarterly. That scheduling capability is a workflow pattern, not evidence that a content app supplies an inventory forecast.
The embedded video provides an additional workflow reference.
Keep purchasing approval distinct from order fulfillment automation. Automating a stock alert or preparing a recommendation is a smaller commitment than authorizing a supplier purchase.
Give the buyer a sheet or dashboard where they can approve, adjust, or reject recommendations. Capture those decisions so you can distinguish a model failure from a sensible response to information outside the model.
How to Build the Forecast in Four Phases
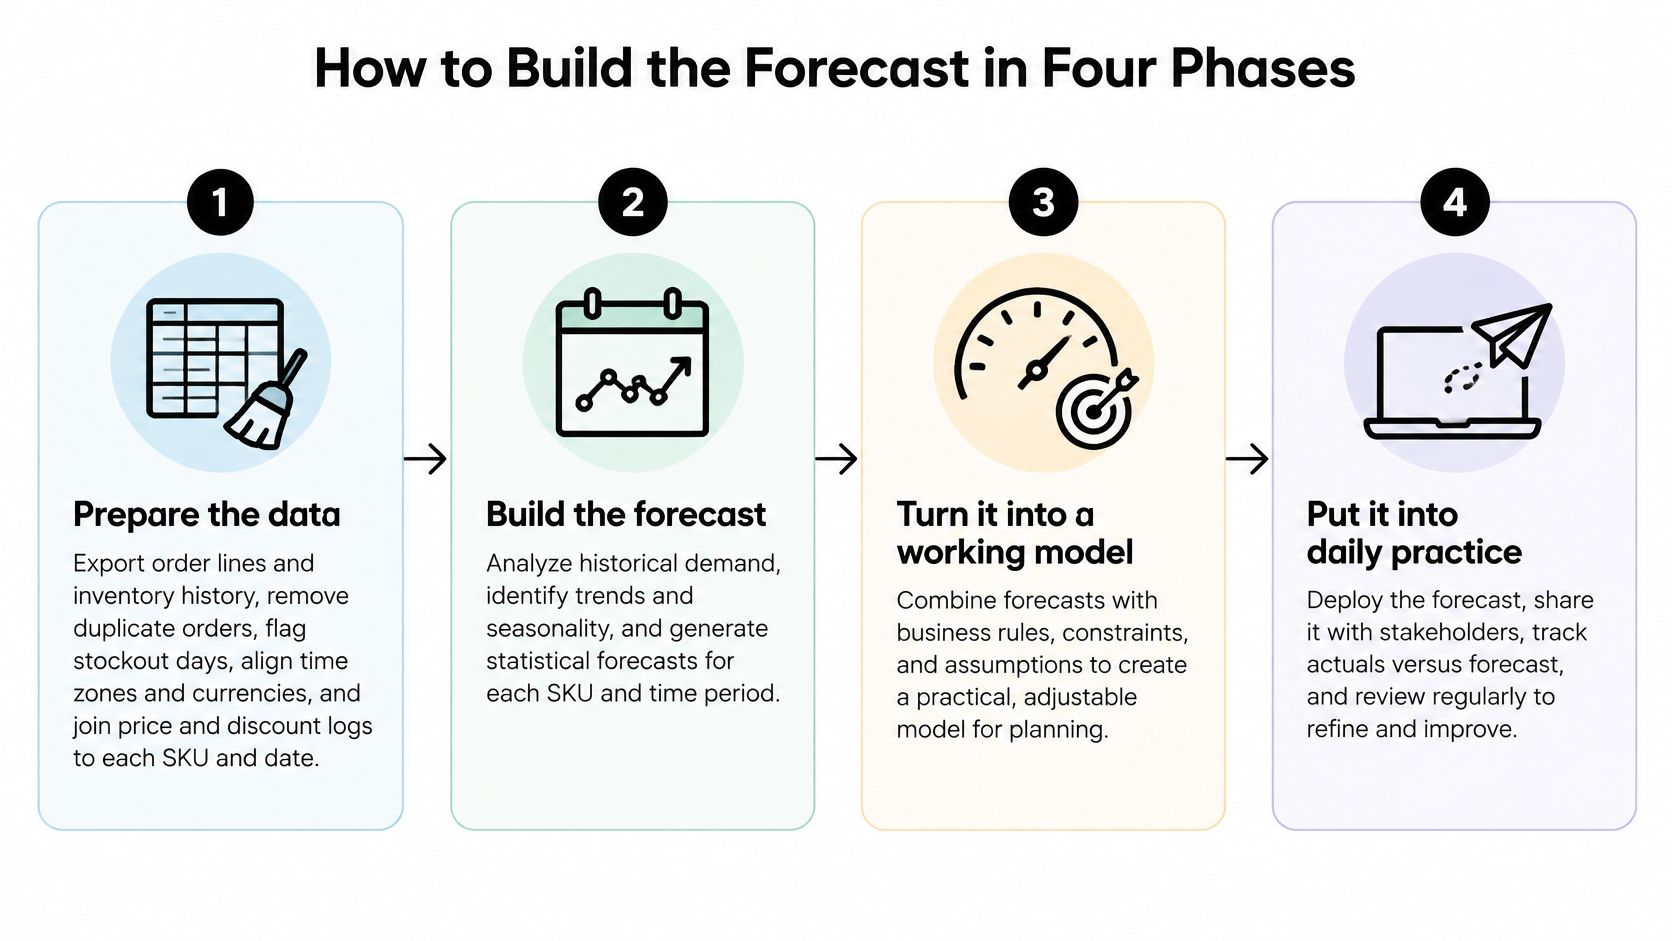
A forecasting project becomes easier to manage when each phase produces something the next person can inspect. Your buyer should be able to trace a recommendation back to its inputs, its test results, and the assumptions used to turn demand into an order.
Use this process flow to organize the work.
Phase one, prepare the data
Create a reproducible dataset that joins order lines, inventory history, prices, and discounts by variant, location, and date. Remove duplicate records, align time zones, and distinguish quantities from monetary values before handling currencies.
Decide how to treat returns. A return recorded long after a purchase shouldn't automatically erase demand from the return date, and a cancelled order shouldn't be treated like a fulfilled sale without a deliberate reason.
- Deliverable: A checked dataset with documented definitions and exception flags.
- Common slip: Joining exports on changing product titles or inconsistent SKU codes instead of stable variant identifiers.
Phase two, select the candidates
Write down the forecast horizon, eligible products, and comparison criteria before fitting models. Prepare a seasonal-naive baseline, then test plausible statistical and machine-learning alternatives using the same input eligibility rules.
Create features that would have been available at each historical decision date. A planned promotion is legitimate input; its eventual realized sales lift isn't.
The common slip is an unfair comparison. If a candidate gets cleaner history or easier test periods, you can't attribute its advantage to the model.
Phase three, validate through time
Use rolling, time-based backtests. Train on an earlier period, forecast the next decision window, then move the cutoff forward and repeat. This recreates the sequence in which your buyer would have received information.
Randomly mixing past and future observations doesn't recreate that decision. It can allow future seasonal or promotional information into training and make the results look more dependable than they are.
- Deliverable: Results separated by product group, ordinary trading, and campaign conditions.
- Common slip: Accepting a favorable recent period as sufficient evidence without testing different trading conditions.
Inspect poor results, not just averages. Determine whether the issue comes from missing inputs, an unsuitable method, or an unpredictable event.
Phase four, deploy with a buyer checkpoint
Publish forecasts with uncertainty ranges and a clearly recorded issue date. Convert them into replenishment recommendations using supplier lead times, incoming orders, available inventory, and the protection level your buyer has chosen.
Keep a forecast version history, set a retraining schedule, and identify who handles data failures. Store the original forecast before updating it, otherwise you'll lose the ability to judge what the team knew when ordering.
Release gate: A forecast is ready for controlled use when its out-of-sample results are credible, its uncertainty is useful, and someone owns the purchasing decision.
Don't let deployment mean unattended purchase orders. Begin with recommendations that the buyer reviews, and expand automation only after the operating process has earned that responsibility.
Pitfalls That Quietly Undermine Forecasts
A forecast can pass a technical demonstration and still fail in daily buying. Test the assumptions behind it before treating its recommendations as dependable.
Challenge the apparent certainty
Unavailable means unwanted. Test whether the system recognizes periods when customers couldn't purchase. Quarantine suspect observations and make the treatment of hidden demand visible instead of accepting a cleaned series without explanation.
A strong test score means a fair test. Audit what information was available at the forecast date. Check for future campaign results, retrospectively edited tags, or other inputs that wouldn't have existed when the buyer placed the order.
A precise number means a confident estimate. Require a usable uncertainty range and an exception flag when conditions fall outside the model's experience. A neat decimal doesn't establish trustworthiness.
Campaign performance is ordinary performance. Compare planned promotional assumptions with what ran. A delayed launch or changed discount can invalidate the scenario without proving the underlying model is defective.
Challenge the business case
Better accuracy means more profit. A 2025 survey of 105 retail executives reported by Chain Store Age found that only 16% were currently using AI for demand forecasting, with adoption constrained by expertise gaps, budgets, and uncertainty about return on investment. For a smaller merchant, those operating constraints belong in the evaluation, not in an implementation footnote.
Calculate the commercial result after excess inventory, markdowns, carrying costs, data preparation, and software fees. Also check whether you could act on the recommendation: a correct forecast offers limited immediate benefit if supplier minimums or cash limits prevent the corresponding order.
Another retailer's result proves your case. Your assortment, margins, supplier terms, and purchase frequency determine whether a forecasting improvement is worth paying for. Enterprise adoption stories don't replace a controlled test on your own collection.
Use customer-facing signals carefully too. A back-in-stock workflow can capture interest and notify shoppers when inventory returns, but registrations aren't interchangeable with completed purchases.
Before trusting the system, check that:
- The comparison is fair: The candidate and baseline faced the same purchasing conditions.
- The direction is acceptable: Persistent overbuying or underbuying isn't hidden inside an average.
- The uncertainty is credible: Outcomes fit the ranges often enough for their intended use.
- The economics improve: The inventory benefit survives implementation and operating costs.
Forecast accuracy is an intermediate metric, not proof of value. The buying outcome is the stronger test.
Start With One Collection and Measure the Result
Choose a collection with consistent product identifiers, usable inventory records, and enough history to test its important selling patterns. Prefer an assortment your buyer understands well enough to explain unusual results.
Write the go or no-go rule before the pilot begins. Specify which business outcomes must improve, which must not deteriorate, and what costs you'll include. That prevents a visually impressive dashboard from becoming the reason to expand.
Keep the pilot small and auditable
Build a comparison sheet with the seasonal-naive forecast, the AI candidate, the buyer's proposed order, and the eventual decision. Record weighted error, stockout events, remaining inventory, markdowns, and the time spent preparing and reviewing recommendations.
Separate historical testing from live results. Backtests can compare forecasts, but estimating the inventory outcomes of alternative past orders requires assumptions about lead times, availability, and fulfilment. Label those simulated outcomes clearly.
During the live pilot, keep purchasing approval with the buyer. Log overrides and their reasons, especially supplier constraints, campaign changes, or product-quality concerns that the model didn't receive.
Scale only when the collection shows a worthwhile operating improvement without an unacceptable inventory trade-off. If the evidence is mixed, narrow the rollout to the products that benefit rather than forcing a catalog-wide decision.
Make failure useful
A failed pilot can reveal that your priority is better availability history, cleaner campaign records, or more evidence for new products. Keep buyer-led ordering where it works, repair the weak inputs, and retest before increasing the commitment.
For adjacent catalog work, our recommendation is to try the free plan first, run one collection, and inspect the results before upgrading. That's a sensible evaluation habit, not a claim that SEO or content tools replace a demand-planning system.
Your next step is concrete: select the collection, name the buyer who owns the test, and write the decision rule into the review sheet. Don't buy complexity until the result justifies it.
We offer ten focused AI apps for SEO, product content, and product visuals, each with a free plan, alongside custom Shopify automations that can support a more organized operating workflow. Visit Yassine Malti to explore the tools or discuss a custom integration for your forecasting inputs and buyer-review process. For occasional bulk catalog work, use pay-as-you-go packs instead of committing to a subscription.
Shopify apps by Yassine Malti
Put this into practice
-

ALT SEO · Image alt text
AI alt text for every product image · 100 images/month free
-

RANKit · Meta titles & descriptions
AI meta titles and descriptions, sized for Google · 50 meta tags/month free
-

TAGit · Product tags
SEO-friendly product tags, generated in bulk · 50 tags/month free